Making Metadata
To most people, metadata is a chore, but it is very necessary for others to understand how to use your data in an appropriate way. In order to underscore the importance of this task, metadata is required for inclusion in the NRGIS Library and to be placed on a Web Mapping Application. We have provided this guide to help you easily fill out your metadata. Remember, no one else can do this for you, as you are the one that knows how it was made. This should be seen as a way to help others fully utilize your data.
In this guide, Sections, Tabs, and Field names will be bolded to help you find them. If they are not mentioned, you don't have to fill them in (but feel free to do so!)
Let's get started.
For this tutorial, we'll be using a dataset called lineated_inlier so you should see the name of your file anywhere you see this.
We'll be using a DNR metadata template that will fill in a lot of the fields for you.
Download the DNR_metadata_template
Save this file in the same location as your data.
If documenting a shapefile, name the file the same as the shapefile, but use the double extention of .shp.xml
For this example, you would name the file lineated_ridges.shp.xml
Open ArcCatalog.
Go to View > ToolBars >Metadata
The toolbar looks like this:
Place it where you want in ArcCatalog.
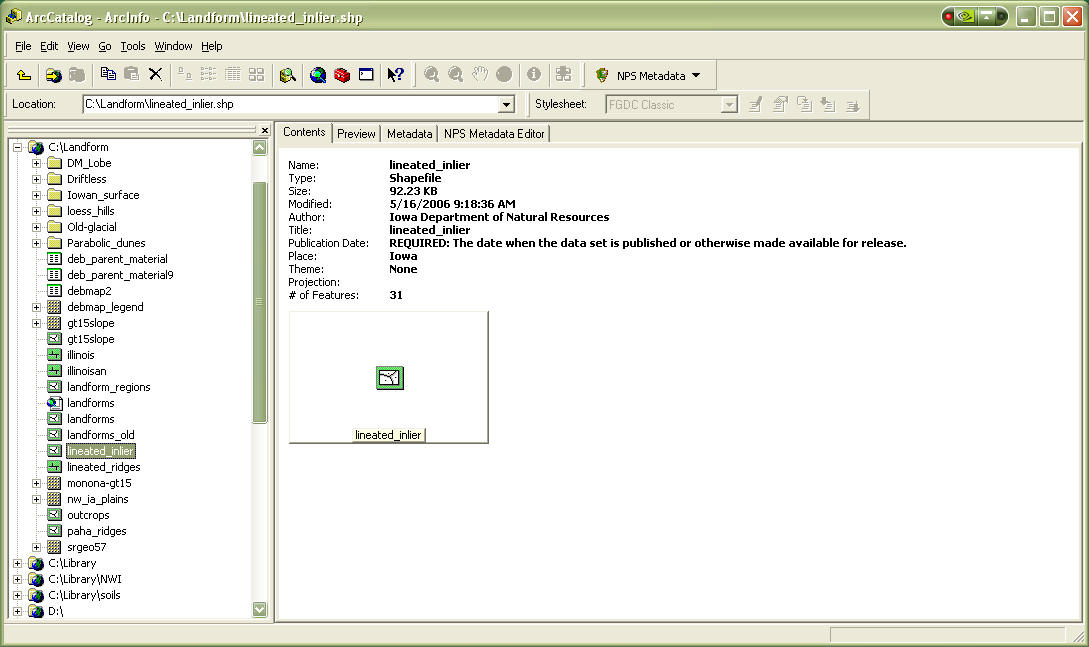
Browse to your datasets's location and click on it in the left hand pane.
You should see something similar to this:
Go to the Metadata tab in the right hand window, it will look something like this:
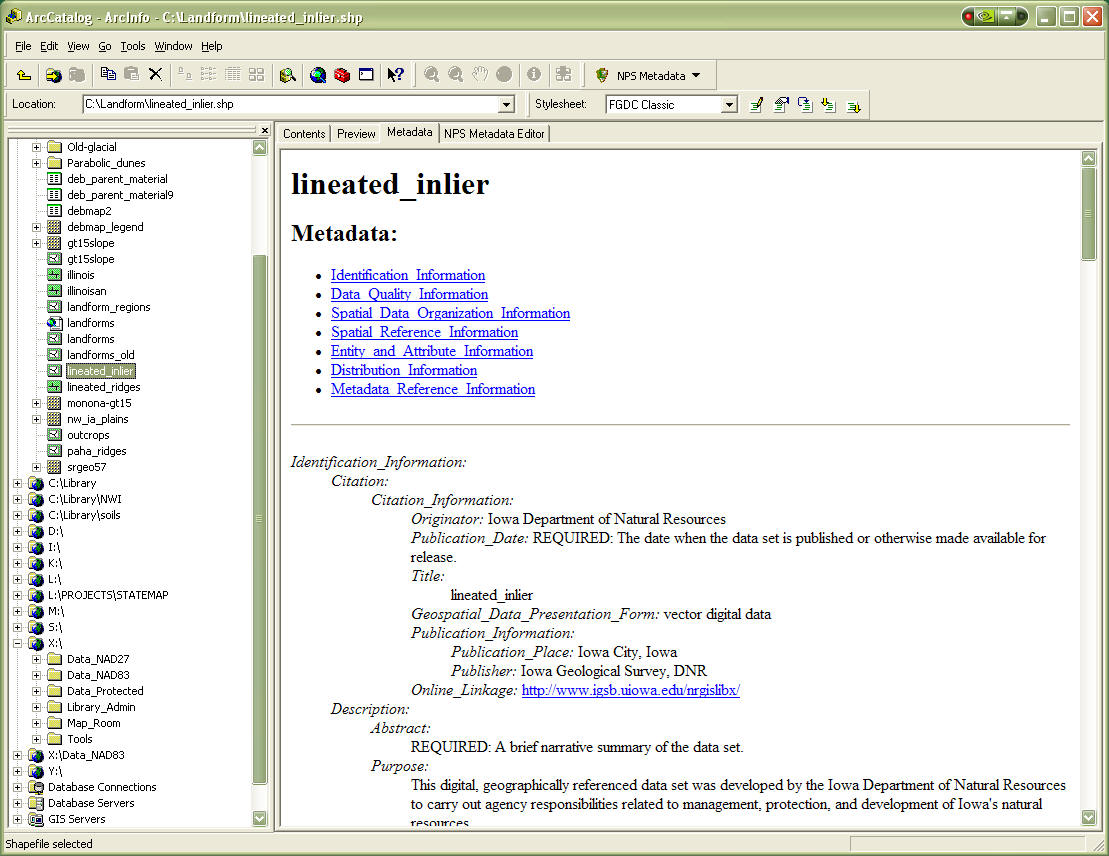
You will notice some of the fields are filled in. Let's start editing.
Click the edit metadata button on the Metadata toolbar. You will see the editor come up, and it will look like this:
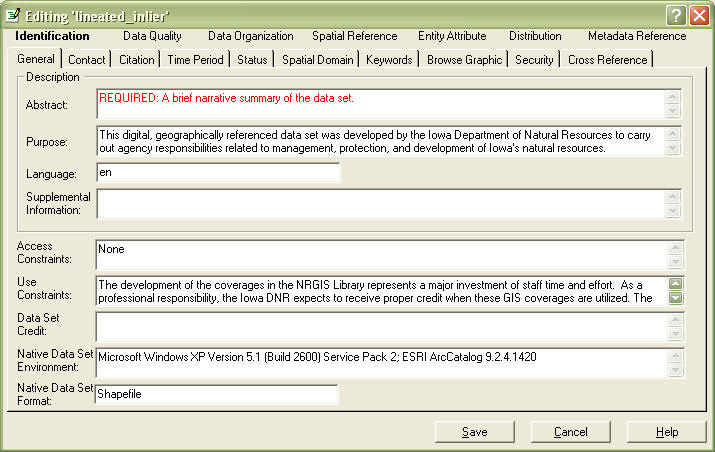
You will see seven sections at the top, with the Identification section highlighted.
In the Identification Section,, you will see 10 tabs, with the General tab open
In the Abstract field, you will need to enter an abstract that describes your data. Generally this is a paragraph or two describing the "who, what, where, when" of your data. be sure to include general content and features, data set form (GIS, image, dbase...), geographic coverage, time period, and special data characteristics or limitations. This section is very important. Give it some thought.
In the Supplemental Information field, enter other descriptive information about the data set. Include information about related tables.
In the Data Set Credit field, you should credit anyone who worked on developing this data.
Go to the Contact Tab
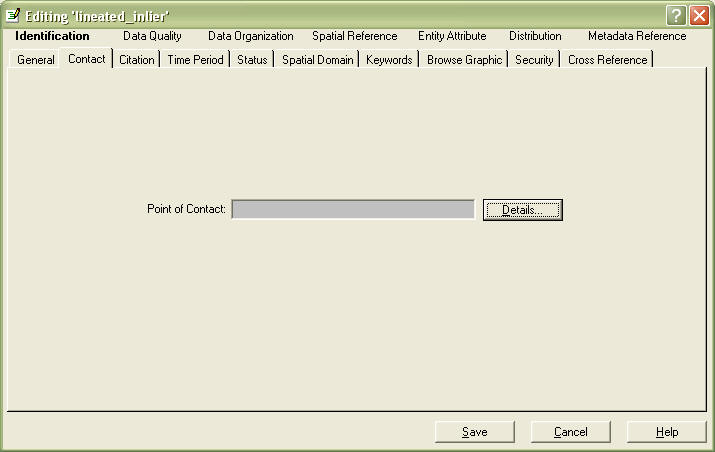
Go to the Details button, it will look like this:
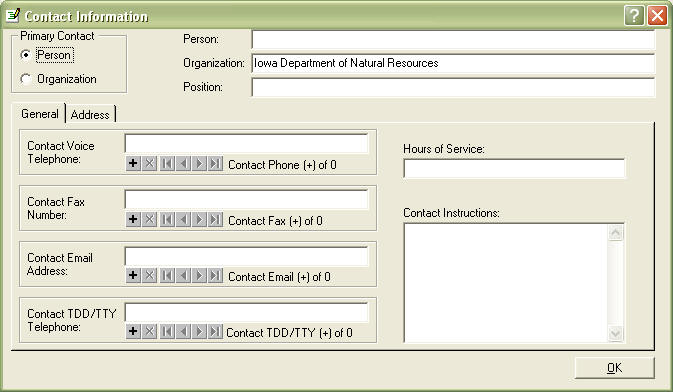
In the Person field, this is the person responsible for the the data, that can answer questions about the data. If you want the contact to be a bureau, or position and not your name, you should change the Primary Contact to Organization.
Other required fields in this tab are the Contact Voice Telephone, Contact Email Address fileds, and the Address tab.
Click the OK button.
Go to the Citation tab.
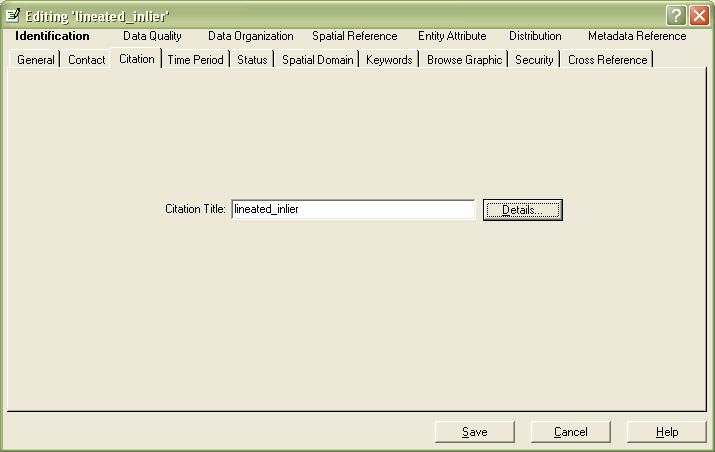
Go to the Details button.
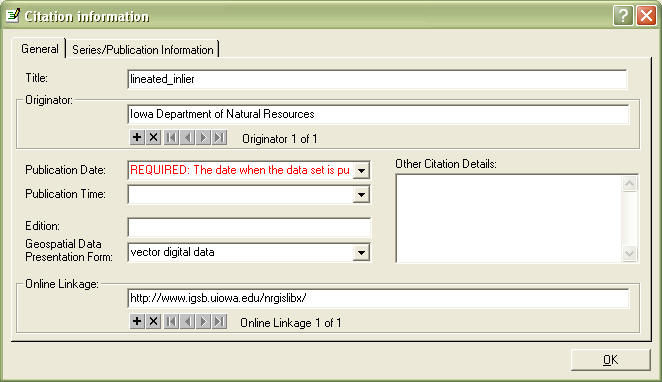
In Title replace file name (default) with a descriptive title of your data - what, when, where...
In publication date, put today's date, in the format YYYYMMDD
In Edition, put the date the file is current to, using the YYYYMMDD format
Hit OK.
Go to the Time Period tab.
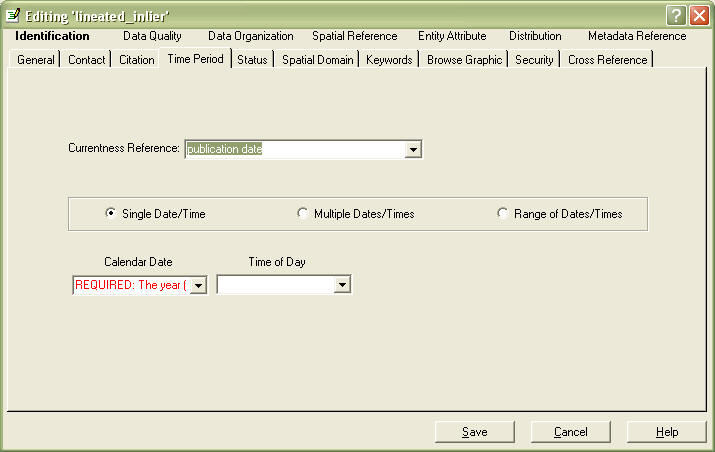
In Currentness Reference, enter the relevant date of the data content. Can be a single date, multiple dates, or a range of dates. For instance, if you have photography that was flown in February, that would be the ground condition date. Fill in with "edition date" if this data will be updated in the future.
In Calandar Date, fill in appropriate date in YYYY format.
Go to the Status tab.
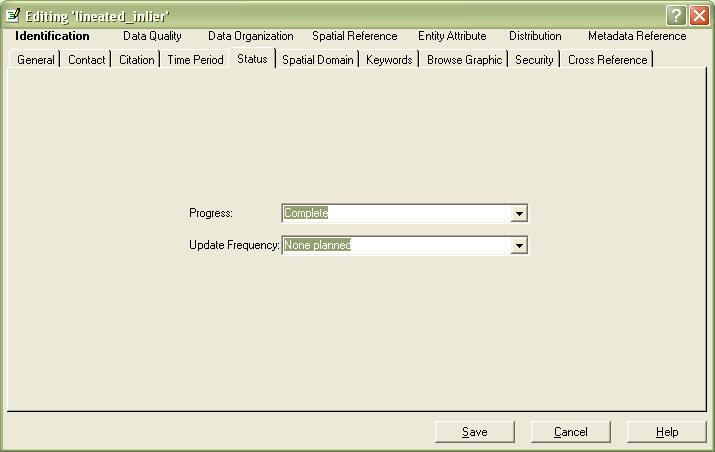
Fill in both fields.
Skip the Spatial Domain Tab,
Go to Keywords Tab
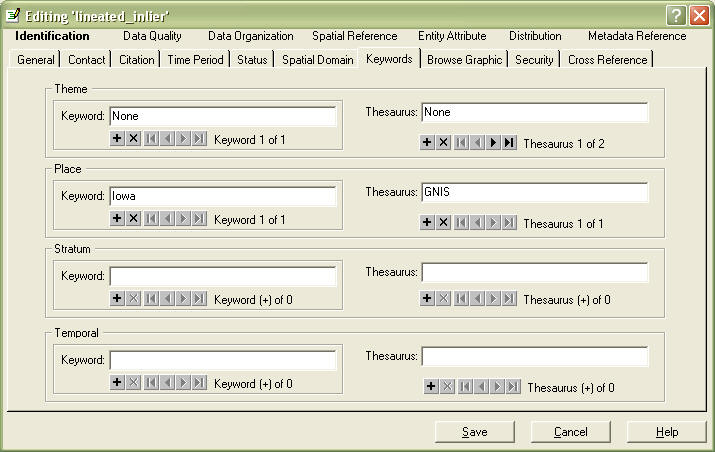
In the Theme Keywords Field, add as many keywords as appropriate. Hit the "+" sign to add more.
In the Place and Temporal Keyword fields, if appropriate.
Skip the Browse Graphic, Security tabs. Do the Cross Reference tab, if there is appropriate data to cross reference (See directions for the Source Information tab below to see how to fill out).
Go to the Data Quality Section, General tab
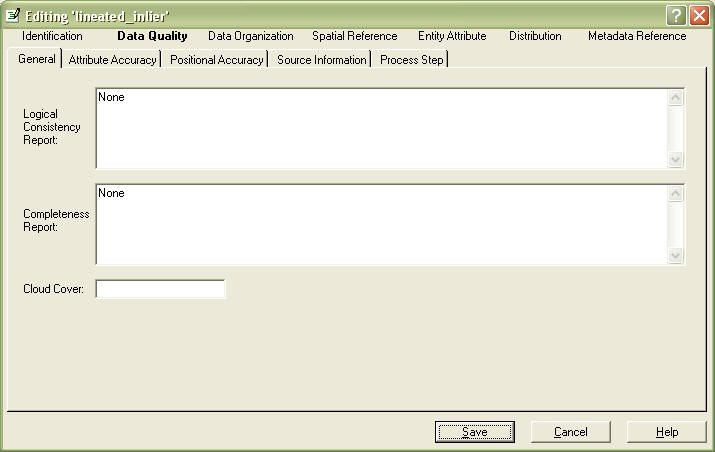
In Logical Consistancy Report field, did you check for bad values and conditions? Tests used to check for data inconsistencies including topological checks (clean and build), and data base QA/QC routines such as: Are the X values always between ‘0’ and ‘100’? Are all ‘Y’ values text format? Does value Z always equal the sum of values ‘R’ and ‘S’? Leave as None if no tests were done.
In Completeness Report field, describe data that you didn't collect, or locations missing, etc. Is there anything I might expect to be in the data set that isn’t? Identification of data omitted from the data set that might normally be expected, as well as the reason for the exclusion. This may include geographic exclusions, ‘data was not available for the South Shores neighborhood’; categorical exclusions ‘municipalities with populations under 1,000 were not included’; and definitions used ‘floating marsh was mapped as land’.
Go to Attrubute Accuracy tab
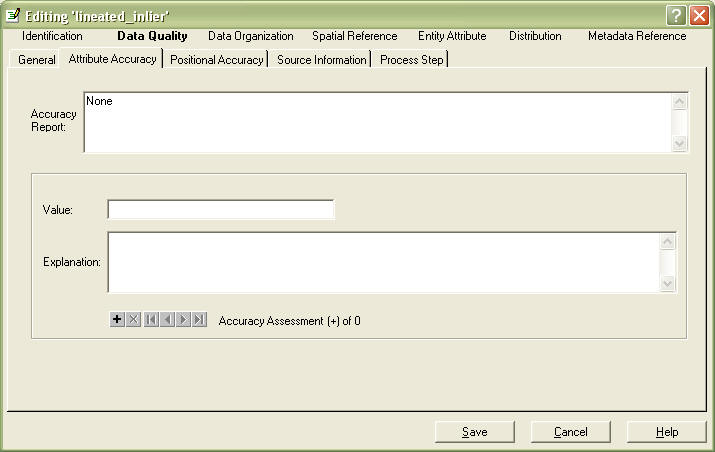
In Accuracy Report, give a description how accurate your attrubutes are, and how to figure this out.
You do not need to fill in the values, unless you feel it's necessary to fully understand your data and use it correctly.
Go to Positional Accuracy Tab
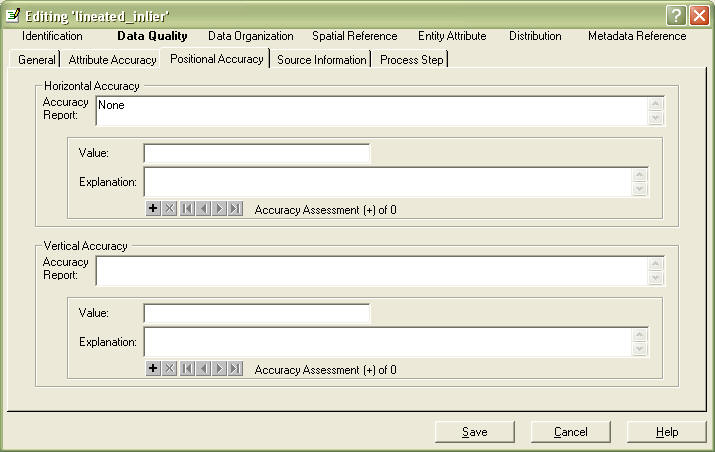
In Horizontal Accuracy - Accuracy Report field, fill in with a description.
How sure are you that the pine tree is where you say it is?
Assessments as to the horizontal and/or vertical location of the feature. May
refer to field checks, survey quality, cross-checks with other locational
references, etc. This may depend on your sources, so you may want to mention them here and be
sure to properly cite them in the next tab.
Source Information tab, General subtab
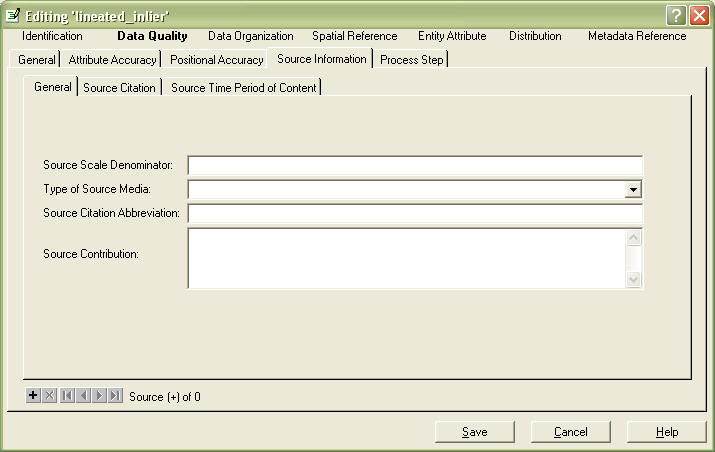
This is a compound element. You can add additional sources by hitting the "+" sign near the bottom left. NOTE that each source has 3 tabs.
In the General Tab, Source Scale Denominator, fill in with a number, i.e. 24000 for a 7.5' USGS quad map.
In Type of Source Media, type in if it's a digital database, paper map, database, etc.
In Source Citation Abbreviation, give it a short name you can use later in process step tabs.
In Source Contribution, you can enter appropriately, or leave blank and describe in process step tabs.
Go to the Source Citation Tab, Hit the Details... button.

In Title, enter the title the data should be cited as.
In Originator, enter all of the authors of the data
The other fields should be filled in appropriately, especially the Online Linkage if it has one. Hit OK
Go to the Source Time Period of Content tab.
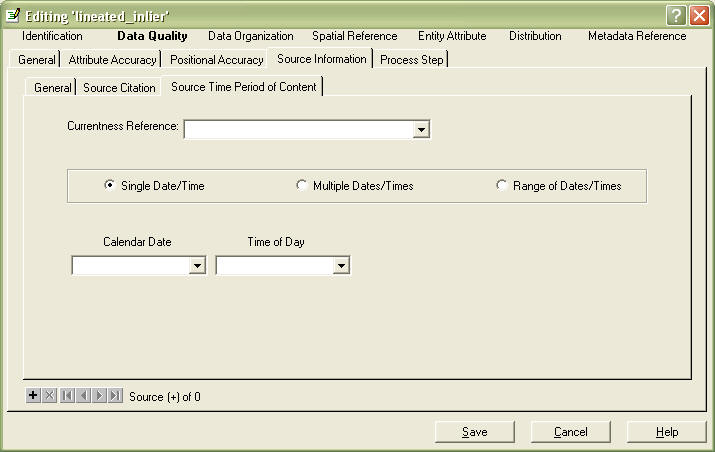
enter appropriate fields.
If you have another source, go back to the General tab, and hit the "+" sign and repeat these last three tabs.
Go to the Process Step tab
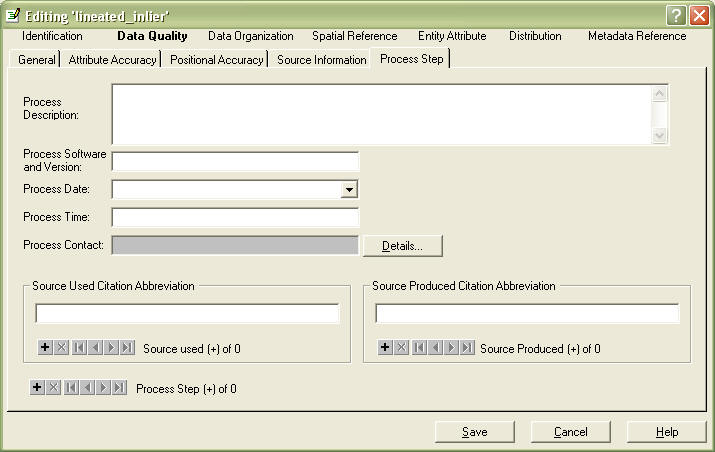
This is a compound element. you can enter multiple process steps, or enter them all in the Process Description field.
In the Process Description Field, you should describe the steps you went through to create this dataset. include field data collection, digitization, and processing steps. You can enter the Source data for each step (Remember making up an abbreviation? - Use it here) in the Source Used Citation Abbreviation tab. You can also enter the person that performed that step by hitting the Details tab.
Skip the Data Organization and Spatial Reference Sections and
Go to the Entity Attribute Section (Your last section!!!)
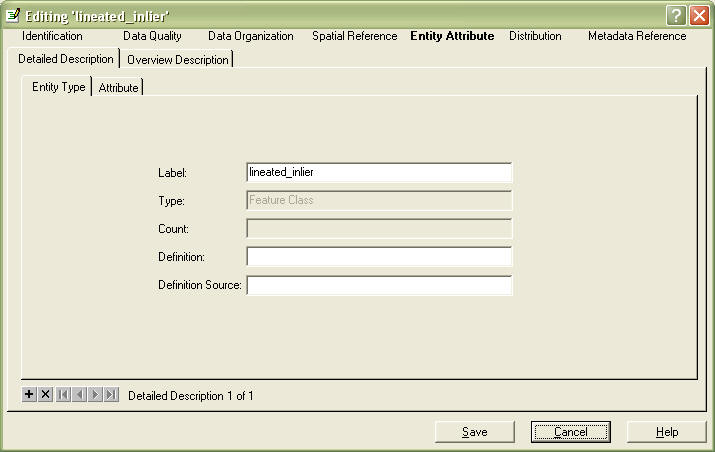
You have 2 choices here, you can fill in Detailed Description tab for
fully explaining your attribute definitions, and values,
or if you have definitions in a text file, you can dump the text into the
Overview Description tab, Entity and Attrubute Overview field.
For full descriptions, go to the Detailed Description tab, Attribute subtab
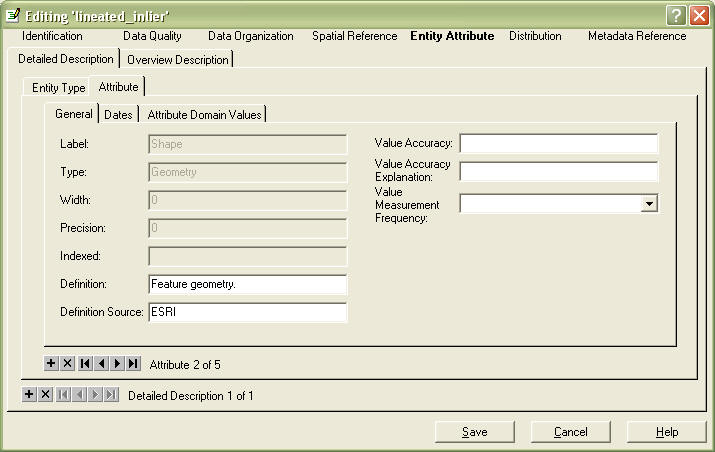
You will see your first field in the Label field, it will be greyed out. You will notice that it says "Attribute x of x", depending on the number of fields you have. To go to your next attrubute, click the forward arrow.
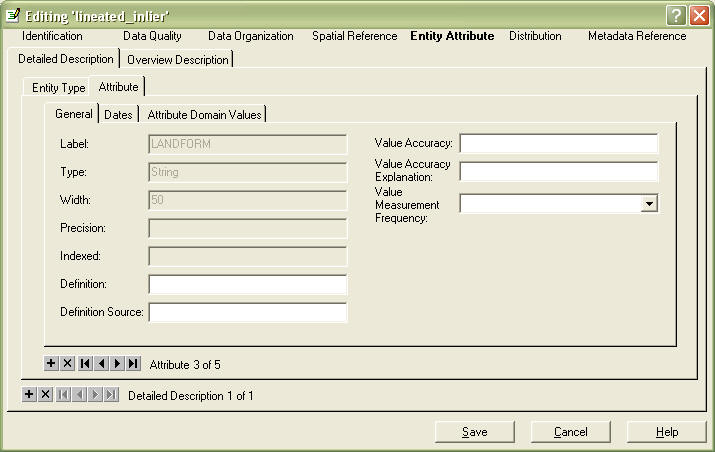
In the Definition field, you will need to define what this field means. In the Definition Source field, enter with the appropriate source.
You can skip the rest of the fields on this tab and go to the Attrubute Domain Values tab.
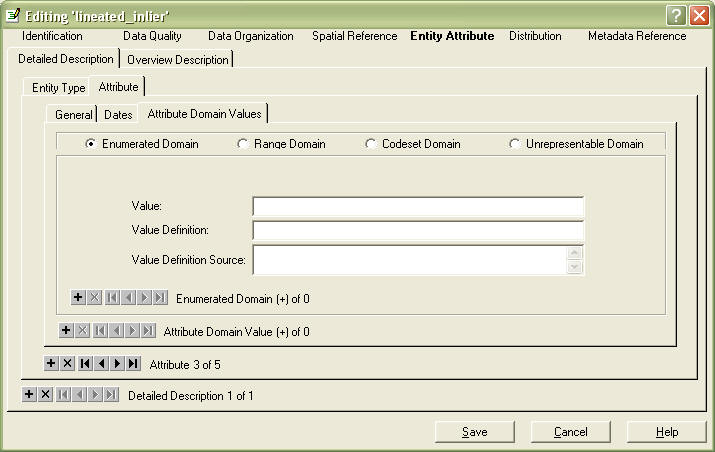
Choose the appropriate Domain:
Enumerated Domain: a defined set of possible values, a picklist,
example: Anderson land cover classes
Range Domain: a sequence, series, or scale that has defined maximum and
minimum values - can be numeric or alphabetical, example: date fields
Codeset Domain: any published codeset, examples: USGS Digital Line
Graph codes, FIPS codes
Unrepresentable Domain: any value that is not prescribed, example: names
Fill in the Value and Value Definition fields
Go to the Overview Description tab
Overview_Description
YOUR DONE!!!!!!!
Send to the GIS Librarian, and they will do the rest!